Retail · In progress
Tyger Valley: retail media in the food court.
A retail media network at Tyger Valley in Cape Town, launched in October 2026: large LED screens at the food court and Woolworths entrance, ten brands per loop. Retail media, real impact: where premium brands meet Cape Town's most valuable shopping moments.
- Retail media
- LED screens
- Food court
- Category exclusivity
- Large-scale activations
- Brands per loop
- 10
- Slot length
- 30 s
- Plays a month per slot
- 3,806
- Mall visits a year
- 11.2M


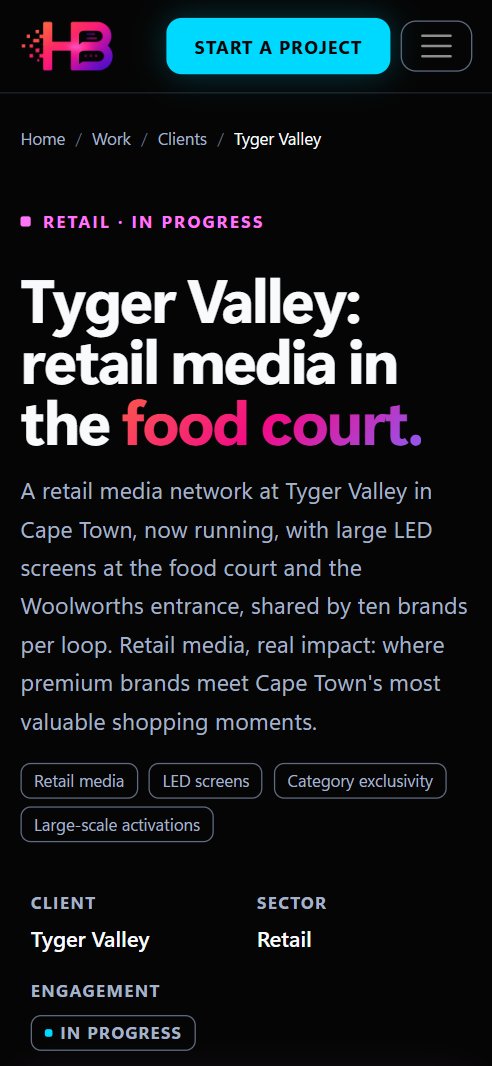
A retail media network by Hello Brand for Tyger Valley, co-branded with the mall. Launched in October 2026; results to follow.
Chapter 1 of 8
The brief
Tyger Valley is one of the Western Cape's most established regional shopping destinations. Hello Brand has turned its busiest, longest-dwell space into premium media, connecting brands with shoppers at the moment they are most open to influence.
Consumers are harder to reach and expect more. Traditional media reaches audiences where they are; retail media reaches them in environments that drive decisions; commerce media combines context with intent to influence what people buy; and shopper media builds relevance, preference and long-term loyalty. The world's leading retailers are investing billions in retail media because it works, it is measurable and it drives real impact.
Insight
While shoppers move throughout the mall, they pause, stay and engage in the food court.
- Launched
- October 2026
- Where
- The food court at McDonald's, and the Woolworths entrance
- The loop
- Five minutes, ten brands, 30 seconds each
- On air
- All trading hours, seven days a week
- Trading hours
- 74 a week
- Bookings
- From one month to a year
The idea
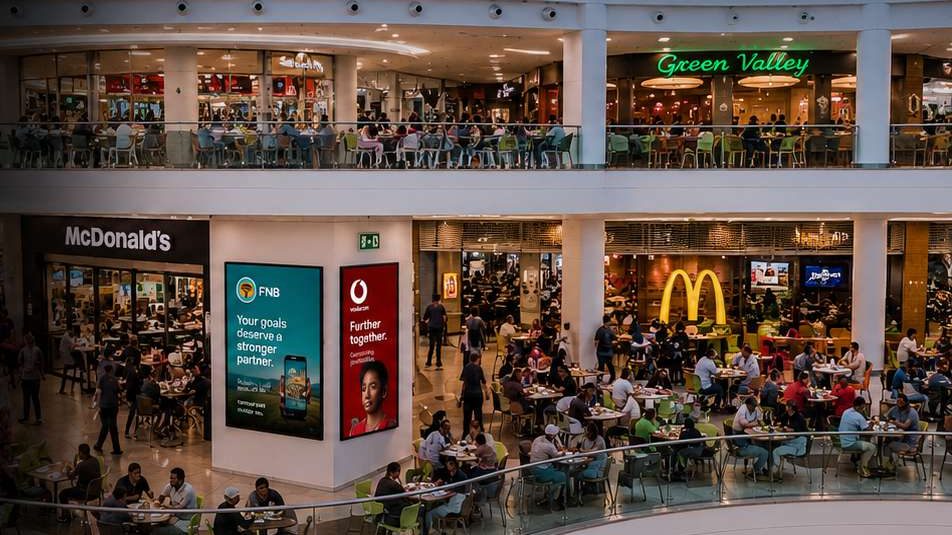
Retail media. Real impact.
Put large LED screens where shoppers stop, and run them as one shared loop: few brands, seen by many, at the mall's highest-dwell point. The opportunity has three sides, as Brand Hailer first framed it for the mall in 2021.
- Tenant brands: drive shoppers into their stores
- Outside brands: reach the right shoppers directly
- The landlord: clean data, insight and a strategic advantage
- Every brand: drive awareness, build preference, deliver results
Chapter 2 of 8
The screens, and the space around them
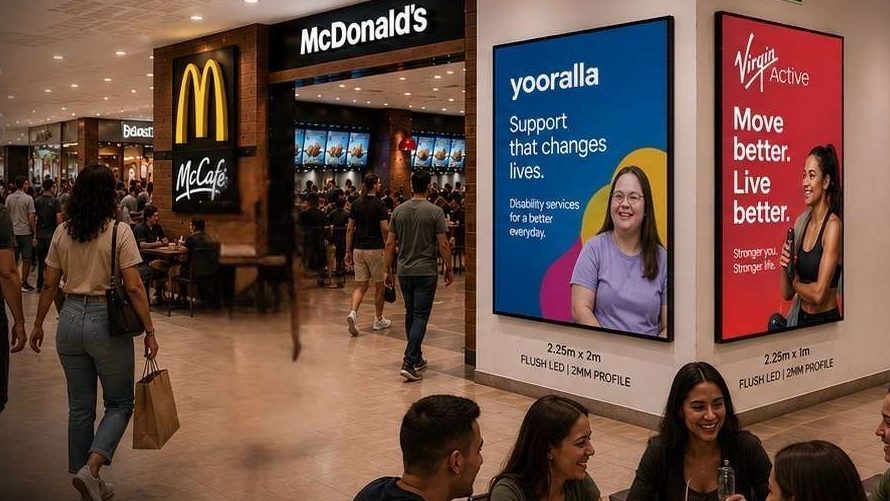
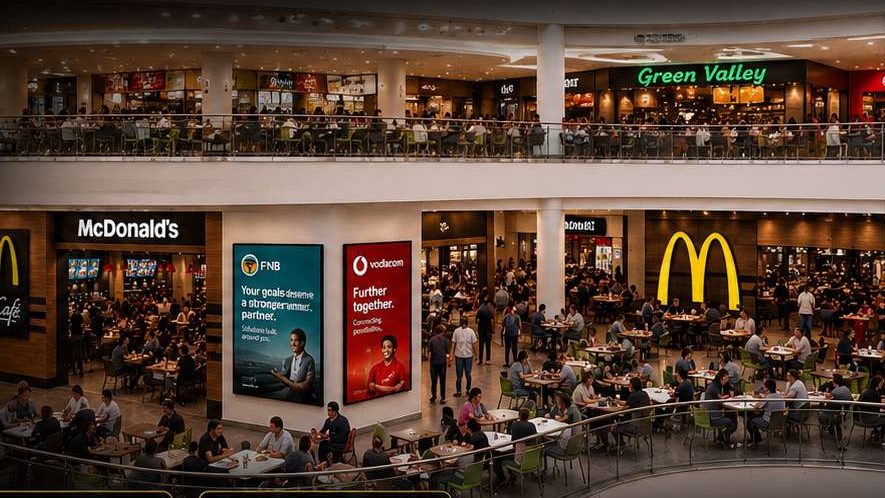
A large digital canvas at the food-court entrance, visible from a main walkway and beside a high-frequency meal moment. Dining is the highest-dwell, highest-attention part of a mall visit: more time, more attention, more influence.

- Main screen
- 2.25 m by 2 m flush LED
- Portrait screen
- 2.25 m by 1 m flush LED
- Profile
- 2 mm, flat to the wall
- Position
- Food court, McDonald's entrance
Where shoppers stop
Shoppers arrive with a purpose, explore and compare, eat, and then buy. The screens sit at the third step, where people sit down and look up.
The Woolworths entrance
The second location is the Woolworths entrance on the first floor, where transparent LED screens sit on the store windows. The creative plays across the glass while shoppers can still see into the store, so a brand launch, a new season or a beauty range is the first thing people see as they walk in.


One loop, ten brands
- A five-minute loop with ten 30-second slots, one per brand, shared equally.
- Every five minutes, all day: 12 plays an hour for each brand, from 09:00 to 20:00 Monday to Saturday, and 09:00 to 17:00 on Sundays and public holidays.
- Category control: only ten brands per loop gives each one standout presence and a premium share of voice.
Chapter 3 of 8
Who passes by
Affluent LSM 8 to 10 shoppers from a catchment that runs from the Northern Suburbs, Durbanville, Brackenfell and Bellville to Century City and the Cape Town CBD: a powerful catchment, a connected community and a proven destination.
Who passes the screen
11,204,931
Mall visits in 2025
Nortech people count
33,000+
Shoppers a day
38 min
Average dwell
LSM 8 to 10
Audience
Affluent shoppers
Mall visits a year
Footfall counted across the site, 2023 to 2025: 32,557,980 in all
| Category | Value |
|---|---|
| 2023 | 10,651,844 |
| 2024 | 10,701,205 |
| 2025 | 11,204,931 |
Source: Nortech International yearly site analysis for Tyger Valley (June 2026). The mall's footfall, not campaign results.
These are the mall's own visitor figures, counted by Nortech: footfall grew every year, from 10.65 million visits in 2023 to 11.2 million in 2025. They describe the place, not how many people saw a screen. Measured screen audiences follow in the results.
Chapter 4 of 8
How brands buy in
Book a 30-second slot in the five-minute loop on the main screen or the portrait screen. Partners choose how long they stay, from a one-month launch to owning their category for a year. The longer the booking, the lower the monthly rate.
What one slot delivers
- Every hour
- 12 plays
- Monday to Saturday
- 132 plays a day
- Sundays
- 96 plays a day
- Every week
- 888 plays
- Every month
- About 3,806 plays
- Trading hours
- 74 a week
Built for brands in banking, telecoms, cars, insurance, drinks, groceries and snacks, gaming, toys, fashion, electronics, retail, property and education, and for the stores inside the mall that want to pull shoppers through their doors.
Four ways to book
Launch: 1 monthR12,500
Perfect for short bursts that make an immediate impact: launches, promotions and product releases.
Main screen R12,500 and portrait screen R7,500 per month per slot.
Amplify: 3 monthsR11,250
Build frequency, boost visibility and stay top of mind, with bonus exposure across peak times and a consistent brand presence.
Main screen R11,250 and portrait screen R6,750 per month per slot.
Dominate: 6 monthsR10,500
Establish authority and lead your category, with premium rotation, seasonal planning support and enhanced visibility.
Main screen R10,500 and portrait screen R6,250 per month per slot.
Own the category: 12 monthsR9,750
Own the conversation and be the brand everyone sees, with category exclusivity, strategic collaboration and co-branded experiences.
Main screen R9,750 and portrait screen R5,750 per month per slot.
Large-scale activations
Food-court activations around big moments, such as major sporting events. Pricing on request.
Rates per month for one 30-second slot, excluding VAT. Availability is confirmed when you book.
Book advertisingChapter 5 of 8
From attention to action
Every slot should give shoppers a clear next step inside the mall: notice the screen, engage with it, act on it, and let the brand measure what happened.
- Notice: full-screen creative in a high-traffic mall location
- Engage: sport, music, sampling or interactive content
- Act: a QR code, an offer, directions to a store or a product trial
- Measure: potential views, reach, frequency, dwell and delivery
Ways in
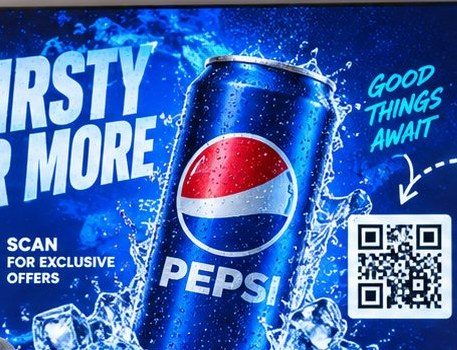
A code on the screenScan for an exclusive offer, straight from the advert (visualisation). The network's own codeOn the network's loop, the code opens this page. On the phoneNo app to download: the code opens in the browser.

Offers that reward a scan
The idea goes back to 2021, when Brand Hailer designed an advertiser solution for the mall: a tenant brand asks shoppers one quick question, and the answer unlocks an instant reward, such as R50 off a first purchase, with points and cashback after that. The shopper gets value, the brand gets clean, first-party insight, and the sale happens in the store a few steps away.
Chapter 6 of 8
What's live now
The screen at Tyger Valley, live since the network launched in October 2026. The infrastructure is installed and running, so each new partner starts with content, measurement and the shopper's next step.


On the wall, at the food-court entrance
Stills from the same footage: the LED wall faces the walkway into the food court, beside the McDonald's counter, so every shopper heading to eat walks towards it.
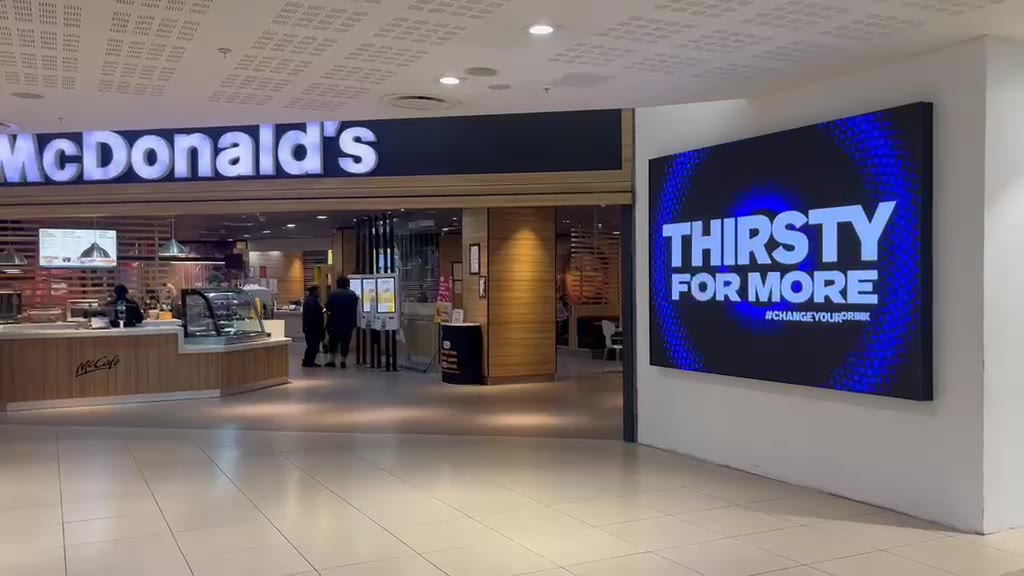
The wall in placeBeside the McDonald's counter, facing the walkway. 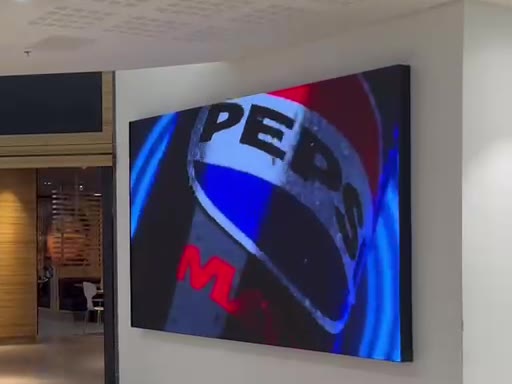
A brand on the loopA 30-second slot, full screen. 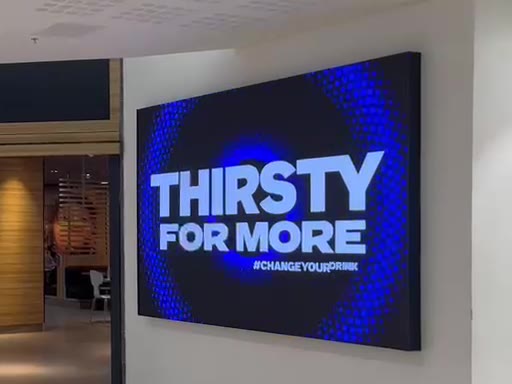
The next slotThe loop moves on to the next message.


Your brand could be here.
About a million visits a month pass the food court: put your brand in the path of purchase.
On the loop
Up to ten brands, 30 seconds each, every five minutes through trading hours.
Open for bookings
Slots on the main and portrait screens, from one month. See the four ways to book.
Chapter 7 of 8
What's next
The loop is the base. Around it, the food court can host large-scale activations, and the network can grow with the mall.
- Large-scale food-court activations around big moments, such as major sporting events
- The Woolworths entrance: transparent LED on the store windows
- Campaign bursts beyond the screen: escalators, sampling and music
- The first 90 days: set up the measurement zone and calibrate how views are counted
- Compare the first location and content tests, then plan the next
- Build once at Tyger Valley, then take the same model to other shopping centres
Shared by few. Seen by many.
Chapter 8 of 8
The results
Live on the wall. Results to follow.
The Tyger Valley network launched in October 2026. Results are added here once the first partners have run and the screens have delivered their first figures: measurable impact at every stage, from brand awareness to in-store influence and sales uplift.
Tyger Valley retail media dashboard
What it will report
12 weeks · sample
- Sample
10,573
Plays delivered per brand
- Sample
4,318,640
Exposures
- Sample
+13 pts
Brand awareness
- Sample
+8.6%
Sales uplift
Delivery
- Sample
10,573
Plays delivered per brand
30-second plays logged for each brand on the loop over 12 weeks
- From the case study
888
Plays a week per slot
Scheduled: 12 an hour through 74 trading hours
- Sample
7 of 10
Brands on the loop
Slots booked in the five-minute loop
| Item | Value |
|---|---|
| W1 | 881 |
| W2 | 884 |
| W3 | 879 |
| W4 | 888 |
| W5 | 886 |
| W6 | 872 |
| W7 | 885 |
| W8 | 883 |
| W9 | 880 |
| W10 | 887 |
| W11 | 884 |
| W12 | 864 |
of scheduled plays logged as delivered
| Item | Value |
|---|---|
| Snacks and drinks | 2 |
| Tenant stores | 2 |
| Banking | 1 |
| Telecoms | 1 |
| Fashion | 1 |
Audience
- Sample
4,318,640
Exposures
Calibrated potential views of the loop in the screen's zone
- Sample
612,380
Reach
Distinct devices in the screen's zone
- Sample
7.1
Frequency
Potential views per person reached
- From the case study
33,000+
Shoppers a day
The mall's own count
- From the case study
38 min
Average dwell
The mall's own figure for a visit
| Item | Value |
|---|---|
| W1 | 341,820 |
| W2 | 694,280 |
| W3 | 1,053,190 |
| W4 | 1,402,360 |
| W5 | 1,764,940 |
| W6 | 2,136,180 |
| W7 | 2,491,810 |
| W8 | 2,852,580 |
| W9 | 3,218,990 |
| W10 | 3,577,280 |
| W11 | 3,946,230 |
| W12 | 4,318,640 |
- Morning, 09:00 to 12:00 24%
- Lunch, 12:00 to 15:00 41%
- Afternoon, 15:00 to 18:00 26%
- Evening, 18:00 to 20:00 9%
Impact
- Sample
+13 pts
Brand awareness
Aided recall among shoppers who passed the screen, against shoppers who did not
- Sample
6,214
In-store influence
Shoppers who scanned a code on the screen for an offer, directions or a trial
- Sample
+8.6%
Sales uplift
Partner store sales against the four weeks before launch
| Item | Value |
|---|---|
| Passed the screen | 34% |
| Did not pass it | 21% |
| Item | Value |
|---|---|
| W1 | 318 |
| W2 | 402 |
| W3 | 455 |
| W4 | 487 |
| W5 | 512 |
| W6 | 538 |
| W7 | 549 |
| W8 | 561 |
| W9 | 574 |
| W10 | 590 |
| W11 | 603 |
| W12 | 625 |
- Offer claimed 46%
- Directions to a store 31%
- Product trial 23%
Rand values excl. VAT. Figures tagged Sample are for illustration only: not results from this or any campaign.
How the screens will be measured
Measurement that separates traffic from delivery: one shared way of counting for the brand, its agency and the mall.
- Potential views
- Calibrated opportunities to see
- Reach
- Distinct devices in the screen's zone
- Frequency
- Potential views per person reached
- Dwell
- Time spent where the screen can be seen
- Dayparts
- Hourly and campaign-period patterns
- Proof of play
- Play logs, uptime and location record
Related work
Stories that used the same services, or worked in the same sector.
-

Woolworths
A strategic concept for Woolworths that connects loyalty, engagement, first-party data, retail media and commerce into one customer ecosystem.
-

PepsiCo
A proposed year-round retail-media pilot for PepsiCo's portfolio, built around a food-court screen at Tyger Valley with measurement and roving activations.
-

Pick n Pay
A proposed Pick n Pay Connect pilot that links football, rugby and Formula 1 sponsorships to scan-and-play games and verified purchases in store.


